Starburst Enterprise query editor overview#
The Starburst Enterprise web UI includes the query editor, a web-based IDE for writing and executing SQL queries. From it you can access all catalogs in the cluster currently available to your user.
Access the query editor at any time by clicking Query then Query editor on the left navigation menu of the web UI. If the left menu is not currently visible, click the ☰ button to restore it.
Requirements#
The query editor is enabled by default in the Starburst Enterprise web UI. Your account in the web UI must have access to your configured catalogs, schemas, and tables in order to explore and query them.
You can optionally configure the cluster’s backend service to allow the query editor to persist work between browser sessions.
Editor pane#
Use the editor pane to type your SQL query of interest, then click the Run button to execute your query. You can also press Ctrl+Enter (⌘+Enter on MacOS) to invoke the currently visible Run button.
Multiple SQL statements can be present in a query tab. In this case, the Run button acts on the statement that contains the cursor, as long as the statement is closed with a semicolon. A statement with a missing semicolon prevents running that statement and all statements below it in the same query tab.
As an alternative to running every statement present in the query editor pane, you can execute multiple adjacent statements or a valid portion of a long SQL statement in a tab by selecting them with your cursor. In this case, the Run button label displays Run {option} selected or Run and troubleshoot selected, depending on your selected run option.
Run options#
There are several variations of the Run button. Use the drop-down arrow in the current Run button to select from the Run options. The Run option you select persists in the browser.
Run (limit 1000): You can have multiple SQL statements in a tab. In this case, the Run button acts on the statement closest to the cursor, as long as the statement is closed with a semicolon. This option retrieves up to 1000 rows of the query’s result set and places it in the results pane. Result sets longer than 1000 rows are truncated as if
LIMIT 1000was appended to the query. If available, you can use the Download link at the top of the results pane to download a CSV file of this truncated result set as long as it is still visible in the results pane. Run (limit 1000) is the default option.Run (neither Limit 1000 or Run all statements are selected): This option behaves identically to Run (limit 1000), except that the result set is limited to 100MB (about 400,000 rows) of results instead of 1000 rows. If the result set of the statement exceeds 100MB, the query editor cancels the execution. If available, you can use the Download link at the top of the results pane to download a CSV file of this result set as long as it is still visible in the results pane.
Run all statements: This option runs statements one by one and retrieves up to 100MB total of results for all statements in the tab, as long as the statements are closed with a semicolon. A statement with a missing semicolon prevents running that statement and all statements below it in the same tab. The result sets are listed in rows on the results pane. Click the result set to view it in the right side of the results pane. If the combined result sets exceed 100MB, the query editor cancels the execution. If available, you can use the Download link at the top of the results pane to download a CSV file of this result set as long as it is still visible in the results pane.
Run all statements (limit 1000) (both Limit 1000 and Run all statements are selected): This option runs statements one by one and retrieves up to 100MB of results for each statement in the tab, as long as the statements are closed with a semicolon. A statement with a missing semicolon prevents running that statement and all statements below it in the same tab. The result sets are listed in rows on the results pane. Click the result set to view it in the right side of the results pane. Result sets longer than 1000 rows are truncated as if
LIMIT 1000was appended to the query. If available, you can use the Download link at the top of the results pane to download a CSV file of this truncated result set as long as it is still visible in the results pane.Run and download all rows: This option retrieves a single query’s entire result set and downloads the file in CSV format to the current user’s default downloads directory. This option is unavailable when you select more than one statement. The name of the file is browser-dependent. Chrome prompts for a filename; Firefox and Safari write to a file named
results.csv, appending a digit or a timestamp if the target filename exists. While the download proceeds, a few rows of sample results appear in the results pane. Use this option when you expect a large result set from a query.By default, Run and download writes a UTF-8 encoded CSV file without a byte order mark (BOM). To prepend a UTF-8 BOM to downloaded CSV files, set
starburst.csv-with-bom.enabled=truein your configuration file.
Note
The ability to download is available by default, but can be explicitly disabled by your platform administrator.
Run and troubleshoot: This option runs a query and downloads a
starburst-query-troubleshooting-[QUERYID].ziparchive that contains diagnostics files:/configs- directory that containscoordinator.zipandworker-<node_id>.ziparchives with the server, catalog, resource group, and access control configuration files from the coordinator and one worker./jmx- directory that containsmetrics-before.jsonandmetrics-after.jsonfiles describing JMX metrics before and after query execution./traces- directory that containsopentelemetry-coordinator.grpc.gzandopentelemetry-worker-<node_id>.grpc.gzwith telemetry data for the coordinator node and every worker that processed a given query./recordings- directory that contains Java Flight Recorder (.jfr) files. Thecoordinator.jfrandworker-<node_id>.jfrfiles are present for the coordinator and every worker that processed a given query. The files can contain environment variables or program arguments passed to SEP. The.jfrfiles can be opened individually or combined to give an overall view of the cluster query processing.query.json- contains query contents, session information, and supplemental information about query execution.query_plan.txt- contains the query plan used for processing the query on the cluster.version.txt- contains the version of Starburst Enterprise platform (SEP).
If anything fails when collecting troubleshooting data, one or more
.errorsfiles are included in the archive in addition to these failures being described in the server logs.
The Run and troubleshoot option is only available to users assigned and
currently switched to the sysadmin role, or an authorized user with
privileges in Insights configuration.
The following optional configuration properties can be added to
config.properties to modify the behavior of the Run and troubleshoot
option:
Property |
Description |
|---|---|
|
Maximum number of queries for which troubleshooting information is collected
in a single session. Defaults to |
|
Duration for which troubleshooting information
is available after a query finishes. Defaults to |
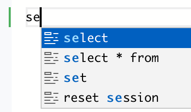
Tab completion#
The query editor anticipates SQL commands and most function names as you type, and presents a dialog that suggests several ways to complete the command or function you started. Select an option and press the Tab key to accept one of the options, or keep typing to close the dialog.
Default location drop-downs#
The right corner above the editor pane contains drop-down selectors that let you
specify a default catalog and schema for those queries. Making these selections
is analogous to using the USE command in a SQL client session.
Conversely, if you specify an actual USE catalog.schema statement as an editor
command, the specified catalog and schema display as current selections in these
drop-downs.
Catalog and schema selectors#
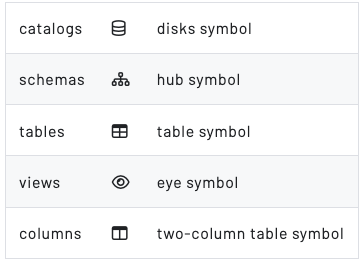
The editor pane includes drop-down selectors to optionally specify the default catalog (disk symbol) and schema (hub symbol) to serve as the context for the query in the current editor tab. This is similar to using the SQL USE command to specify the current query context.
If a valid USE command occurs as part of the current query, its specified
catalog or catalog plus schema are reflected in the drop-down selectors.
Click Select catalog to select a default catalog from the list. You can also filter the catalogs by typing a catalog name into the Filter catalogs box. After you have selected a catalog, you can click Select schema to select a default schema.

Editor tabs#
Click the plus icon (+) to open multiple tabs to keep queries organized and allow multitasking. You can start a long-running query in one tab, then switch to another tab to run additional queries while your first query executes. The query in the previous tab continues to run, and displays results when it completes. If you reload or close the browser while a query is running, the browser prompts you to confirm that you want to leave the site.
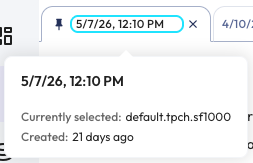
You can pin a tab to keep it first in the tab bar. Multiple pinned tabs form a pinned tab group at the beginning of the tab bar. You can click and drag tabs to rearrange them, but you cannot move pinned tabs into the unpinned group, or unpinned tabs into the pinned group. A pinned tab will remain pinned between login sessions.
To pin a tab, hover over it and click the push_pin pin icon. Pinned icons have a solid black pin, while unpinned tabs have a pin outline.
If the tab bar runs out of horizontal space, overflow tabs are accessible from a drop-down menu tab at the end of the tab bar. From this menu you can perform all the same actions as the horizontal tab bar, such as renaming, pinning, closing, or re-ordering tabs.
The default name of a tab is the date and timestamp of its creation. To rename a tab, click its title, type the new name, and press Enter. Hover over each tab to view when it was created and the currently selected schema in the tab.
Queries that exist on any query editor tab are automatically stored in Saved queries under the query editor tab’s name. You can also share a query tab with other users based on their assigned built-in access control roles. Set the access level for a query tab to allow edits to its contents, or to allow viewing and running only. You must be the owner of the query tab to grant or to remove role access.
For more information on saved and shared queries, see the query editor reference documentation.
Note
The contents of all tabs are reset between web UI login sessions. To persist tab content across login sessions, you must configure persistence in the backend service for your cluster.
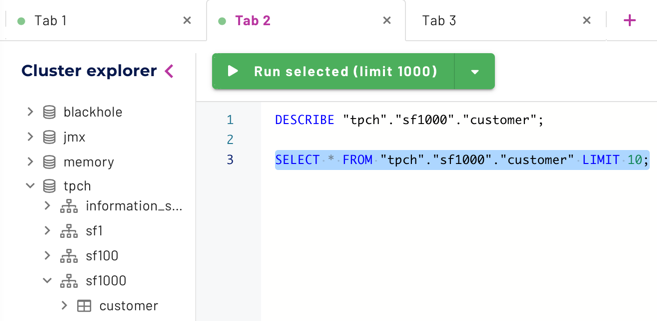
Cluster explorer pane#
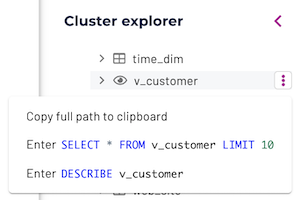
The Cluster explorer pane displays an expandable, hierarchical view of catalogs, schemas, tables or views, and columns configured in the current cluster. To expand an element, click its chevron_right expander arrow. To collapse an element, click its expand_more collapse icon. You can click on a catalog to collapse all schemas under it. Similarly, you can click on a schema to collapse its table list.
Click a catalog to collapse all schemas under it. Click a schema to collapse its table list.
Click or hover over a table name in the explorer to show the full path of the table.
Note
When browsing a catalog, if you don’t find a familiar schema, table, or column that you know from another context, contact your site’s data administrator. It is possible that the cluster connection was made with a catalog properties file that restricted access to that expected element.
Results pane#
When your query is finished executing, the result sets appear in the table below the editor pane.
If multiple results sets are displayed from the use of the Run all (limit 1000) or Run all selected (limit 1000) options, the list of available results sets is displayed on the left side of the results pane with the following fields:
Status - Displays progress while the query is processed, and final status when complete.
Query - The text of the query statement.
Elapsed time - In seconds, since query processing started.
Rows - The number of rows returned.
Above the results table, the status bar displays current query statistics:
Status - Displays progress while the query is processed, and final status when complete.
Avg. read speed - From all sources, in rows per second.
Elapsed time - In seconds, since query processing started.
Rows - The number of rows returned.
Lake acceleration - The percentage of index and cache usage for a query if Starburst Warp Speed is enabled for a catalog. Click the label to go directly to the Index and cache usage tab.
Add to data products - Use this link to add the query to a data product as a data set.
Query details - Use this link to access more details about the query processing.
Download - If you used the Run (limit 1000) run option, then once a query has completed, a Download link appears for the results set in the results pane. Results are not saved, and are only available until a new query is run or your page is closed or refreshed, whichever comes first.
While running, a progress estimate is shown:

If your result set is very wide, or is greater than 1000 rows, it is truncated.

When a query is finished, the status shows statistics and useful links above the columns of result data.

Add to data products#
After running a query, you can use the Add to data product button to create a new data product, or add a dataset to an existing one.
To create a new data product:
Click on the Add to data product button and choose the Create a new data product option from the dialog and click on Continue.
Define your data product by adding a title and description, selecting a catalog, and creating a schema. Click on Save and continue.
Define the dataset. The query that defines your dataset is added automatically. Publish the dataset.
To add a dataset to an existing data product:
Saved queries#
Queries that exist on any query editor tab are automatically stored in Saved queries under the query editor tab’s name.
Click Query > Saved queries in the SEP navigation menu to view and manage your saved and recent queries.
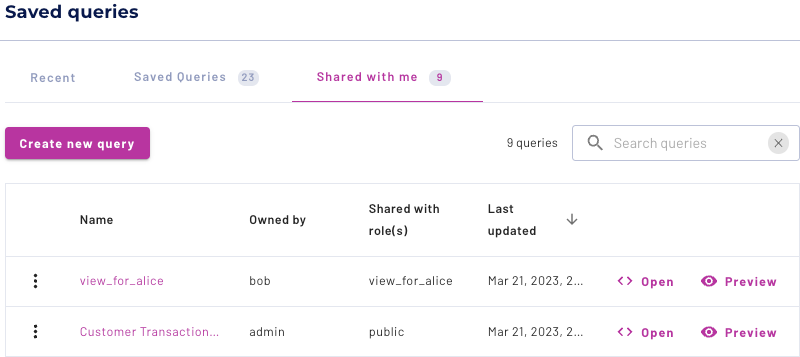
The Saved queries pane organizes queries by when they were created and run, and also displays queries shared with you.
Recent queries: Lists queries that the current user ran in the last seven days. This section does not appear if no recent queries exist.
All tab: Displays all of your saved queries and any queries shared with your current role in a single view.
Your saved queries tab: Lists your queries that are older than seven days.
Shared with you tab: Lists saved queries that other users have shared with your current access control role.
The entries in Your saved queries match your current login name, regardless of your selected role. The entries in Shared with you are based on your currently selected role, which can include access inherited from another role. The tab name shows the current number of entries in each tab.
You can view queries in grid view or list view. In grid view, saved query tiles have a black tab notch at the top, while shared query tiles have a green tab notch. Both views have a Queries per page control.
To open, preview, delete, or rename a saved query, click the more_vertoptions menu provided for each query.
Shared queries#
Share a query tab with other users based on their assigned built-in access control role. Set the access level for a query tab to allow edits to the SQL in the query tab, or to view and run only. You must be the owner of the query tab to grant or to remove role access.
Built-in access control must be enabled and roles assigned to users.
To share a query tab, follow these steps:
From the SEP navigation menu, click Query > Saved queries.
Navigate to the query you want to share; either a Recent query at the top of the pane, or a query in the Your saved queries tab.
Click Share in the query tile or row of a query that you want to share across a role.
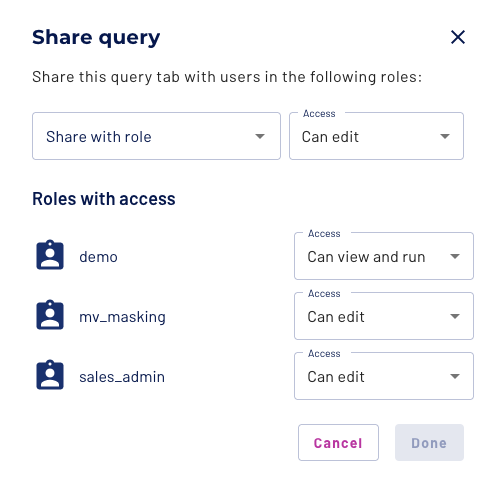
From the Share with role menu, select one or more check boxes for the roles with which you want to share your query tab.
In the Access field, select the level of access for each role:
Can edit - Allow a role to edit the contents or the name of a shared query tab.
Can view and run - Allow a role to view and run queries in the shared query tab.
Remove access - Remove access to the query tab for a role. This option only appears if you are the owner of the query.
Click Done.
View query tabs shared with me#
The Shared with me tab lists all query tabs that have been shared with you based on your assigned roles. From this tab, you can do the following:
Open the query tab in the Query editor.
Preview the query first and then open in the Query editor.
View the query tab name, owner of the query, roles a query was shared with, and the date the query was last updated.
Limitations#
Connections using Kerberos pass-through are not supported.
PREPAREandEXECUTEstatements are not supported.