Use ThoughtSpot with Starburst Enterprise#
Welcome to Starburst Enterprise platform (SEP)! In this topic, you will learn how to:
Connect ThoughtSpot to SEP.
Use SEP to create a ThoughtSpot Liveboard.
Note
This topic assumes the following things:
You have a Starburst Enterprise deployment.
You have access to one or more supported data sources.
You have access to ThoughtSpot.
Once you complete all the tasks in this topic, you are ready to share your first SEP-powered ThoughtSpot Liveboard.
Introduction#
ThoughtSpot Cloud is a browser-based analytics engine that lets you build queries by selecting the table columns that you want analyzed. ThoughtSpot then generates SQL code to implement that query, sends the SQL to the data source, then returns results in grid or graphical form.
ThoughtSpot-generated queries integrate well with tables and views managed by Starburst Enterprise clusters.
Today, you will learn how to build a Liveboard in ThoughtSpot using SEP.
Use the TPCH connector#
Starburst Enterprise connectors provide secure access to a variety of data sources. Use these connectors to define catalogs, which contain the configuration necessary for SEP to access a data source.
Your SEP account includes several connectors that provide test datasets. This topic uses the TPCH connector, which provides a popular sample database used for testing SQL queries and performing analytics.
To configure a catalog using the TPCH connector, create a catalog properties
file called etc/catalog/example.properties with the following content:
connector.name=tpch
Once the catalog file is live, a catalog is created with the name example.
Each of the schemas available in the example catalog provides the same
number of tables; however, each differs in the size of the dataset. For our
purposes, we will use the sf1 schema, the base row size of the database.
Connect ThoughtSpot to SEP#
First, you must connect ThoughtSpot to Starburst Enterprise.
Open ThoughtSpot Cloud in your browser. In the top navigation bar, select Data. Then, in the Data workspace navigation menu on the left, click Connections. Select the Others card from the options provided.
Give your SEP connection a name. In the Choose your data warehouse section, select Starburst.
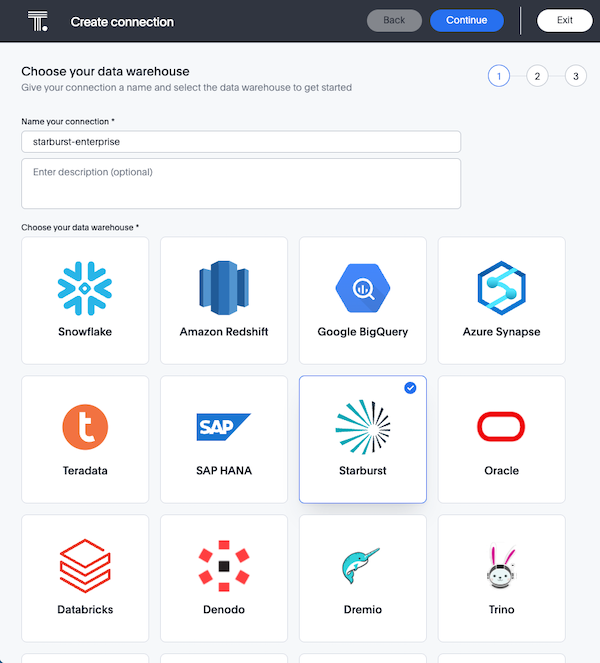
In the top navigation bar, click Continue.
Now, enter your Starburst connection details. Enter your User, Host,
and Port connection strings into their respective fields in the ThoughtSpot
connection dialog. Enter your login credentials for SEP into the User
and Password fields. Leave the Database field empty. If your cluster
uses secure TLS/HTTPS connections, open the Advanced Config drop-down menu.
In the first row of Key and Value fields, enter SSL and true.
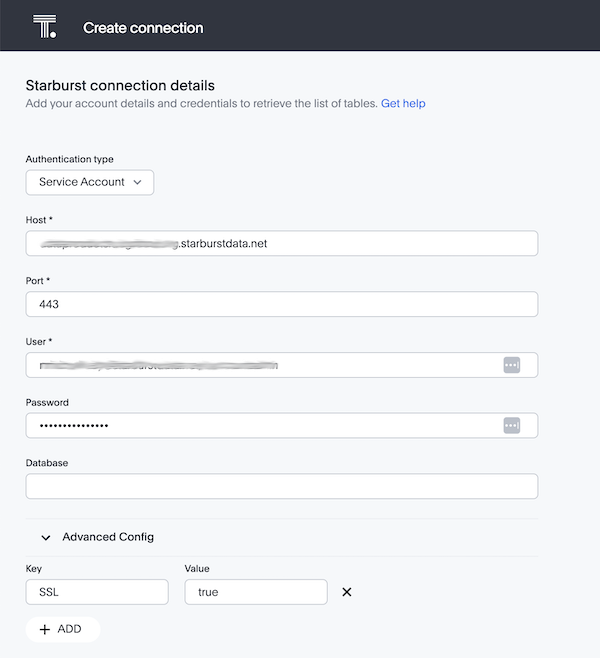
Click Continue.
In the Select tables page, click the expand icon next to the example catalog. Then, expand
the sf1 schema.
Use the checkboxes to select the tables you intend to use to build your ThoughtSpot Liveboard. You can select entire tables or individual columns. Select the lineitem table, the orders table, and the part table.
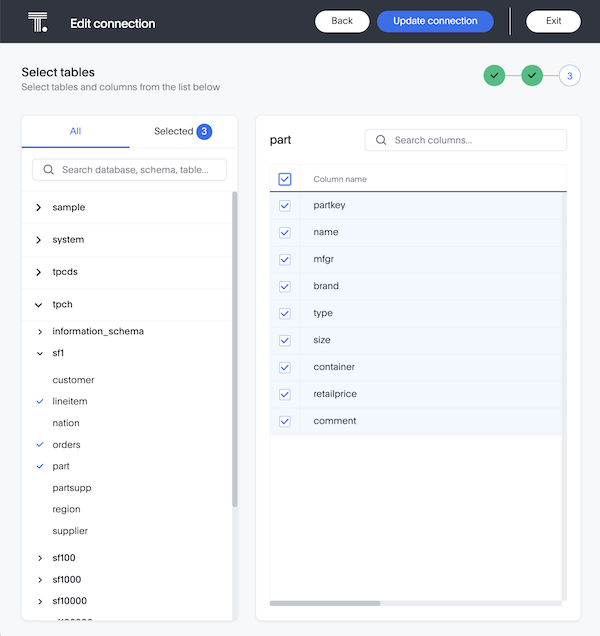
Then, in the top navigation bar, click Create connection.
Set up your data sources#
You should now see the lineitem table, the orders table, and the part table listed in the Connections pane.
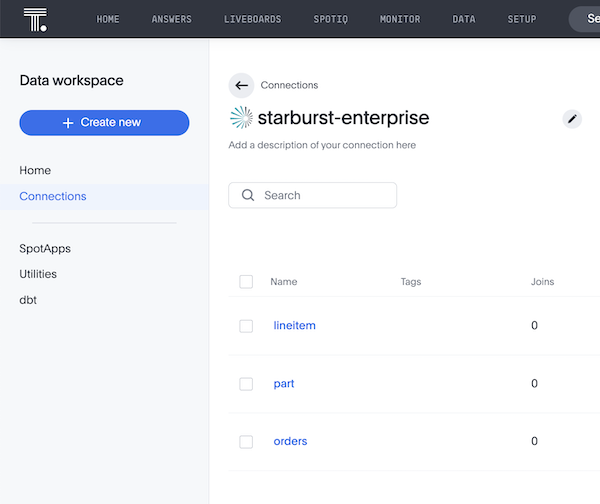
From the list, select the lineitem table. Then, click the Joins tab. Select + Add Join.
In the Join name field, enter a name for your join. Use the drop-down menus to join the orderkey column from the lineitem table to the orderkey column from the orders table. Ensure that you select Inner from the Join Type drop-down menu. In the Cardinality drop-down menu, select Many : 1.
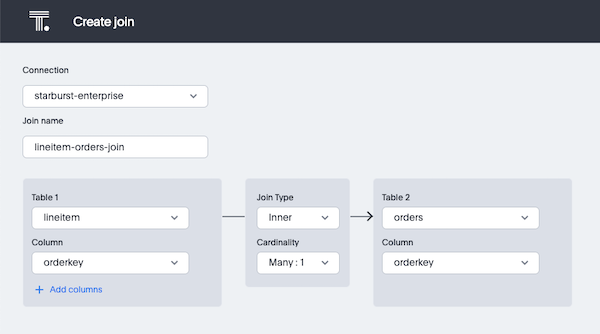
Click Create join to finish configuring the join.
From the Connections pane, select the lineitem table again. Click the Joins tab. Select + Add Join.
In the Join name field, enter a name for the join. Use the drop-down menus to join the partkey column from the lineitem table to the partkey column from the part table. Ensure that you select Left Outer from the Join Type drop-down menu. In the Cardinality drop-down menu, select Many : 1.
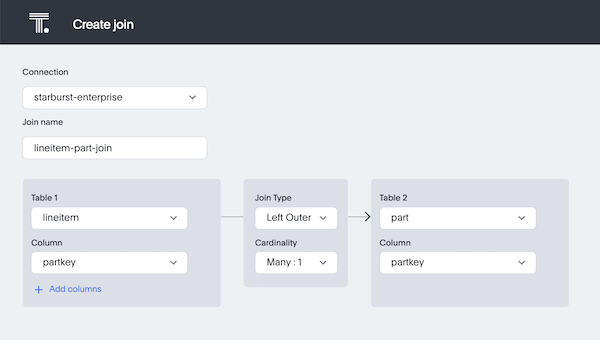
Click Create join to finish configuring the join.
Create a simple ThoughtSpot Liveboard#
Now that you have configured your connection, you are ready to create your first Liveboard.
ThoughtSpot’s Liveboards are interactive, live dashboards. Liveboards organize the data visualizations that you need to see frequently.
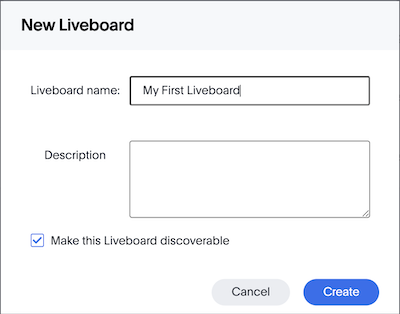
To create a new Liveboard, select Liveboards from the top navigation bar. Then, select + Liveboard
In the New Liveboard dialog, give your Liveboard a name. Click Create.
Search your data#
Click Search Data. In the Select a data source dialog, ensure that you Enable multiple sources. Then, select the checkboxes for both the lineitem table and the orders tables. Click Select to close the dialog.
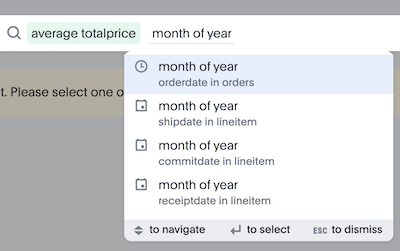
Use the Search bar to query your data. Let’s explore the tpch data’s total
monthly sales over time. In the Search bar, find and select the average
keyword. Then, find and select the totalprice column from the orders
table. Finally, find and select month of year using orderdate in orders.
Click Go. Your chart should look like this:
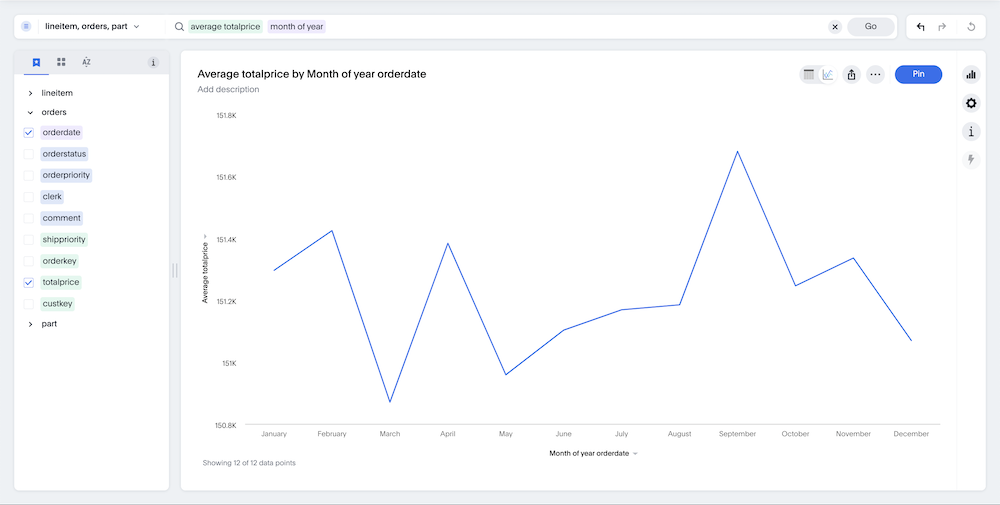
Rename the worksheet to Monthly Sales. To rename axis titles, select Rename from the axis drop-down menu. Rename the Y axis to Total Sales, then rename the X axis to Date.
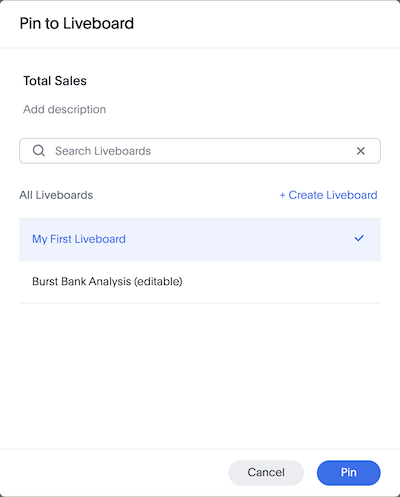
Click Pin to pin the chart to your Liveboard.
Next, let’s explore the tpch data’s sales distribution by product type. Clear
the Search bar. Now, find and select the type column from the part
table. Then, find and select the quantity column from the lineitem
table.
Click Go. Your chart should look like this:
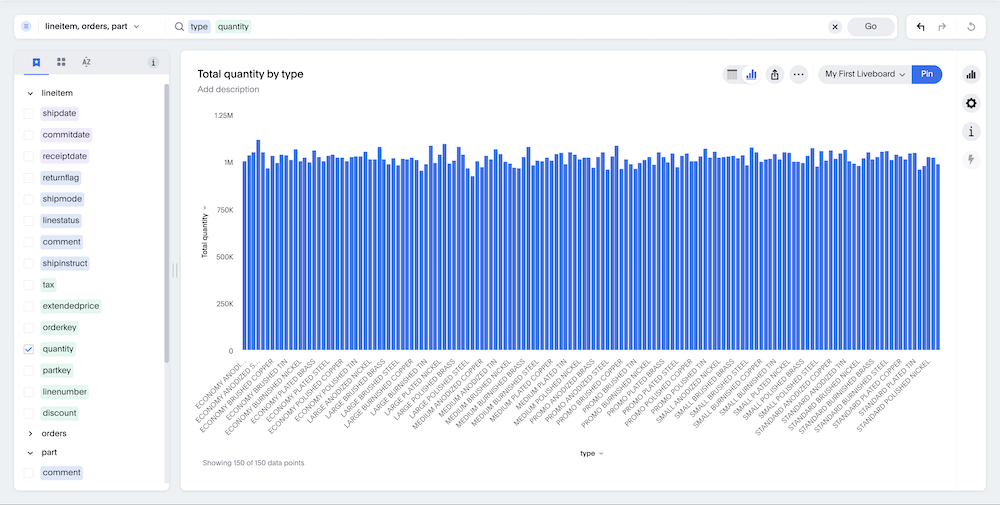
Rename the worksheet to Quantity Sold. To rename axis titles, select Rename from the axis drop-down menu. Rename the Y axis to Quantity, then rename the X axis to Type.
Click Pin to pin the chart to your Liveboard.
View and edit your Liveboard#
Now that you have created some visualizations, you are ready to view and edit your Liveboard.
In the top navigation bar, select Liveboards. Select your Liveboard from the list.
You should now see a Liveboard with both your visualizations arranged side-by-side. Click Edit.
Customize your Liveboard by arranging your visualizations how you want. Change the size of a visualization by clicking the ellipses.
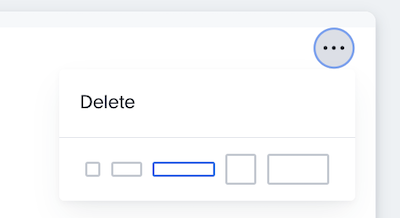
Select the middle option from the menu to expand your visualizations horizontally. Arrange them vertically by dragging the Monthly Sales view above the Quantity Sold view.
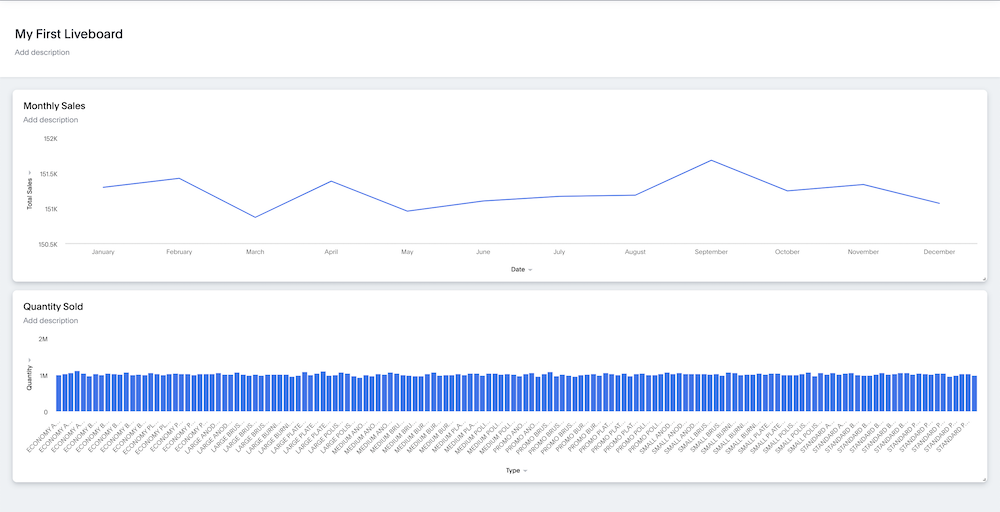
Congratulations, you just created your first SEP-powered ThoughtSpot Liveboard!