Review query history #
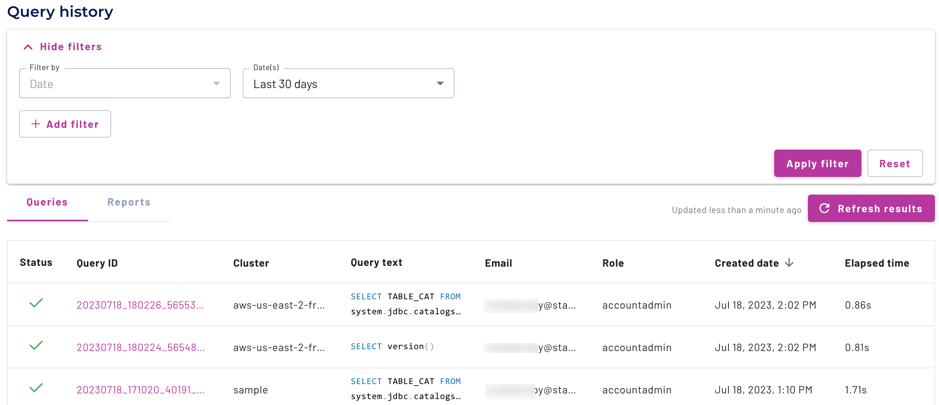
The Query history pane shows a list of all queries processed on all clusters up to the last 30 days. It allows you to view, inspect, and filter completed query execution processes.
Query history is limited to your current login username’s history unless you are
accountadmin or your permissions are set to view all queries.
There are three main features:
Filter #
To use the filter, expand Show filters. The Date attribute field is fixed and cannot be selected. Click Apply filters to reveal the next filter attribute. In the field, expand the drop down menu, then select an attribute.
You can continue to select attributes individually from the drop-down menu or combine multiple selections with + Add filter.
Click to remove a single filter attribute.
Click Apply filters to update the list based on the selected filter attributes.
Click Reset filters to remove all selected filter attributes and update the list.
Use the filter at the top of the page to display queries according to the filter attributes you choose. By default, queries with the date of Today are displayed. You can filter queries using the following attributes:
- Date: Dates include Today, Yesterday, Last 7 days, Last 30 days, and Custom range. The custom range option is limited to the last 30 days.
- Query text: Search text used in query statements.
- Cluster: Filter by cluster name.
- Catalog: Filter by catalog name.
- Schema: Filter by schema name.
- Table: Filter by table name.
- Email: Filter by username.
- Role: Filter by role name.
- Status: Filter by status; Finished or Failed.
Queries #
To reorder the query list by column, click a column name to sort by that column. Click the column name again to reverse the sort order. All columns are sortable except Query ID and Query text.
The queries shown in the list are determined by the defined filter. It is not refreshed automatically so recently completed queries may not show up. Click Refresh results to reload queries in the list.
The following columns are displayed:
- Status uses for successfully completed queries, and for failed queries.
- Query ID shows the unique identifier for each query; click the ID to open the Query details.
- Cluster is the name of the cluster used to process the query.
- Query text displays the full or partial SQL text of the query.
- Email identifies the user who submitted the query.
- Cached results indicates whether the result set of the query has been cached.
- Role specifies the name of the role used by the user when submitting the query.
- Create date uses the browser timezone and shows the start date and time of the query processing.
- Elapsed time is the total duration for processing the query.
There is a limit on the number of rows that can be displayed in the query history list for technical reasons related to the size of event records, not the number of queries sent. Accordingly, you might not see a row for every query sent.
Galaxy Telemetry catalog #
A Starburst-managed built-in catalog named galaxy_telemetry provides
access to a queryable table containing the last 30 days of your query history.
Query history data is located in the query_history table within the public
schema, and available to AWS clusters in the us-east-1 region. New history
data is accessible within two hours of query completion.
The catalog is read-only, and available to the accountadmin role. Additional
roles can be granted access.
For more details on the galaxy catalog, see Catalogs > Galaxy Telemetry.
Is the information on this page helpful?
Yes
No