Data quality #
This page describes how to view statistics and data quality information about a table or view using the Quality tab offered at the table or view level of the catalog explorer. This feature is available for object storage catalogs only.
Schedule optimization tasks #
Use the header section of the Quality pane to schedule data optimization tasks, and view profile data for the current table or view.
Choose a cluster in the Select cluster menu, then click Show profile stats. If you have already collected statistics for the current table, this button is instead labeled Refresh stats.
Use the same drop-down menu to validate query rules with Evaluate quality checks.
Collecting statistics might take some time if the selected cluster needs to restart.
To schedule a data optimization job, click the event_repeat optimization schedule. Provide the following information in the Configure data optimization dialog:
- In the Execution details section, select an executing role and a cluster from the Select execution role and Select cluster drop-down menus.
- In the Maintenance tasks section, choose one or more tasks to schedule. Not all table types support all maintenance tasks.
| Maintenance task | Description | Iceberg | Delta Lake | Hive | Hudi |
|---|---|---|---|---|---|
| Compaction | Improves performance by optimizing your data file size. | check_circle | check_circle | ||
| Profiling and statistics | Improves performance by analyzing the table and collecting statistics about your data. | check_circle | check_circle | check_circle | check_circle |
| Data retention | Reduces storage by deleting data snapshots according to the number of days you specify. You must specify a retention period between 7 and 30 days. | check_circle | |||
| Vacuuming | Reduces storage by deleting orphaned data files. | check_circle | check_circle | ||
| Evaluate custom data quality checks | Evaluates custom SQL data quality checks. | check_circle | check_circle | check_circle |
-
In the Job schedule section:
- Select a Time zone from the drop-down menu.
- Choose the Select frequency or Enter cron expression recurring
interval format.
For Select frequency: Choose an hourly, daily, weekly, monthly, or annual schedule from the drop-down menu. The corresponding values depend on the schedule:
- Hourly: Enter a value between 1 minute and 59 minutes.
- Daily: Enter a time in the format
hh:mm, then specify AM or PM. - Weekly: Enter a time in the format
hh:mm, specify AM or PM, then select a day of the week. - Monthly: Enter a time in the format
hh:mm, specify AM or PM, then select a date. - Annually: Enter a month, day, hour, and minutes in the format
MM/DD
hh:mm
. Specify AM or PM.
For Enter cron expression: Enter the desired schedule in the form of a UNIX cron expression. For example, a cycle scheduled to run weekly at 9:30 AM on Monday, Wednesday, and Friday:
30 9 * * 1,3,5
- Click Save.
Any scheduled data optimization tasks appear in the header section. Use the Configure data optimization to edit or delete a data optimization job.
View data statistics #
The Data quality section provides the following information:
- The total number of columns for the current table.
- The total row count for the current table.
- The Last updated heading displays the timestamp when the statistics data was last refreshed.
- The next optimization job, if one is scheduled to run.
- The total number of successful and failed quality checks are listed under Success and Failed headings respectively.
The Number of records chart plots the changes in the table’s total number of records over the last 30 days. Refreshing the statistics data creates a new data point.
Create and view data quality monitoring rules #
This section describes the information included in your data profile, and walks you through how to create a data quality rule.
Column profile #
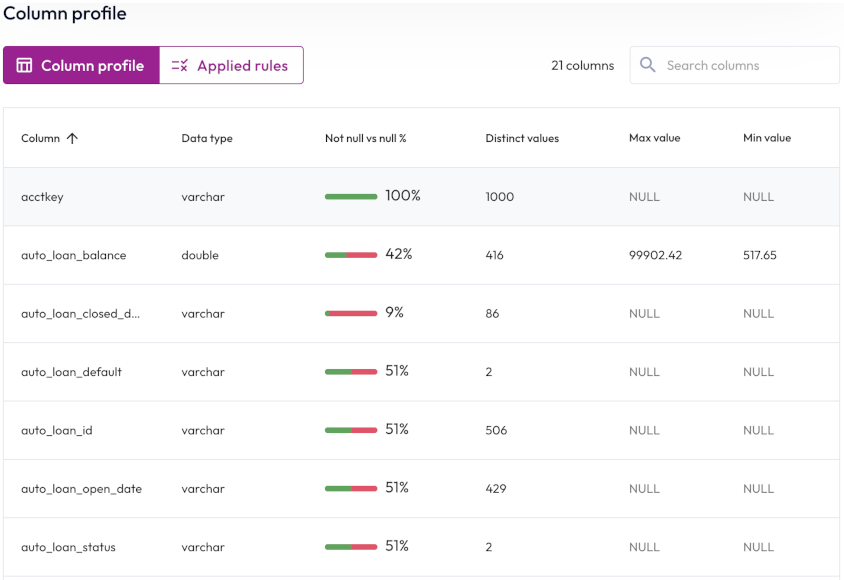
The Column profile button displays the number of columns in the table and displays the following statistics:
- Column: The name of the column. Click the column heading to sort in ascending or descending alphabetical order.
- Data type: The data type for the column’s data, such as
varchar. - Not null vs null %: The percentage of column data that is not
null. - Distinct values: The total number of unique values in the column.
- Max value: The maximum value for columns with numerical data.
Non-applicable columns are labeled
null. -
Min value: The minimum value for columns with numerical data. Non-applicable columns are labeled
null.
To reorder the statistics table, click a column name to sort by that column. Click the column name again to reverse the sort order.
Applied rules #
Data-driven organizations need quick access to data to make critical decisions. With Starburst Galaxy’s data profiling capabilities, you can view the shape of your data and create rules to monitor data quality. These are limited to object store connectors and a limited number of metrics consisting of null value percentage, minimum and maximum values, number of unique values, and volume of data.
Click the Applied rules button to view your data quality monitoring rules, or to create a new rule. The Applied rules tab displays a list of information about each rule such as name, status, description, expression or SQL statement, and severity level.
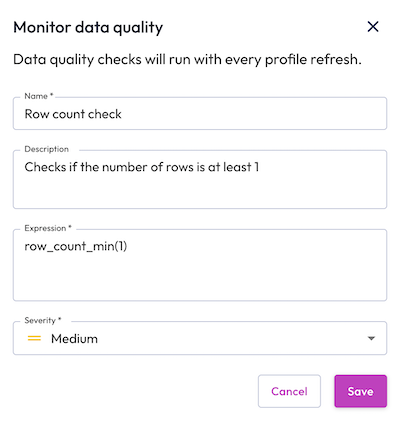
To create a new quality rule:
- Click Create data quality rule.
- Enter a name and description for the quality rule.
- Select a monitoring type. You can monitor data quality with a data quality expression, or with a custom SQL statement.
- Click Test expression or Test SQL to validate your monitoring rule.
- Select the level of severity for the quality check.
- Click Save.

Click the options menu to evaluate, edit, or delete any quality check rule.
Expression-based quality check #
You can write an expression to determine the scope of a data quality monitoring rule. For more details and examples of expression-based quality checks, see Reference -> Data quality expressions.
SQL-based quality check #
You can write SQL statements that evaluate to a boolean that can be run on a
schedule to validate the data. There are two methods for writing a SQL-based
data quality check: a Common Table Expression (CTE) that generates rows and is
followed by a COUNT CASE
statement, or a subquery embedded in a CASE statement.
An example using the CTE method that returns one or more rows if the quality
check fails. If COUNT(*) of CTE evaluates to 0, return TRUE, otherwise
return FALSE:
WITH cte AS(
	SELECT-based <data quality check>
)
SELECT
   CASE
       WHEN COUNT(*) = 0 THEN TRUE
       ELSE FALSE
   END
FROM cte
An example using the subquery method:
SELECT
   CASE
       WHEN avg(totalprice) > 5000 THEN TRUE
       ELSE FALSE
   END
FROM "tpch"."tiny"."orders"
You can author checks for a single column attribute, multiple attribute checks across multiple columns, or attribute checks at the row-level.
A quality check can be executed manually, or scheduled as a cron job. Checks run on a user’s own cluster and incur compute costs.
;.Is the information on this page helpful?
Yes
No